In this recitation we will describe how to generate DOT visualizations of ASTs and show a possible organization for symbol tables.
DOT is a declarative language for specifying diagrams. These diagrams consists of a series of nodes connected to one another with edges. Each node and edge is specified in a statement; statements are seperated from one another with semi-colons.
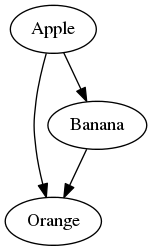
It's probably easiest to learn DOT by example, so consider the following simple diagram:
Here is its specification in DOT:
1  digraph {
2      0 [label="Apple"];
3      1 [label="Orange"];
4      2 [label="Banana"];
5
6      0 -> 1;
7      0 -> 2;
8      2 -> 1;
9  }
Note that each node (specified on lines 2 through 4) has an identifier (1,
2, or 3) and a label (apple, orange, banana). Lines 6 through 8 specify how
the nodes connect; the arrow -> specifies the direction of the
edge.
For visualizing symbol tables you'll want the nodes to be records that contain fields. The following diagram shows an example of this:
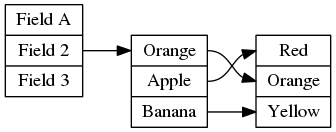
digraph {
    graph [rankdir="LR"];
    node [shape=record];
    0 [label=" <f1> Field A | <f2> Field 2 | <f3> Field 3"];
    1 [label=" <f1> Orange | <f2> Apple | <f3> Banana"];
    2 [label=" <f1> Red | <f2> Orange | <f3> Yellow "];

    0:<f2> -> 1:<f1>;

    1:<f1> -> 2:<f2>;
    1:<f2> -> 2:<f1>;
    1:<f3> -> 2:<f3>;
}
Note that we seperate fields in a record with pipes |, and label fields with an
angle bracketed identifier (for example <f1>).
You can read more about DOT on its documentation page.
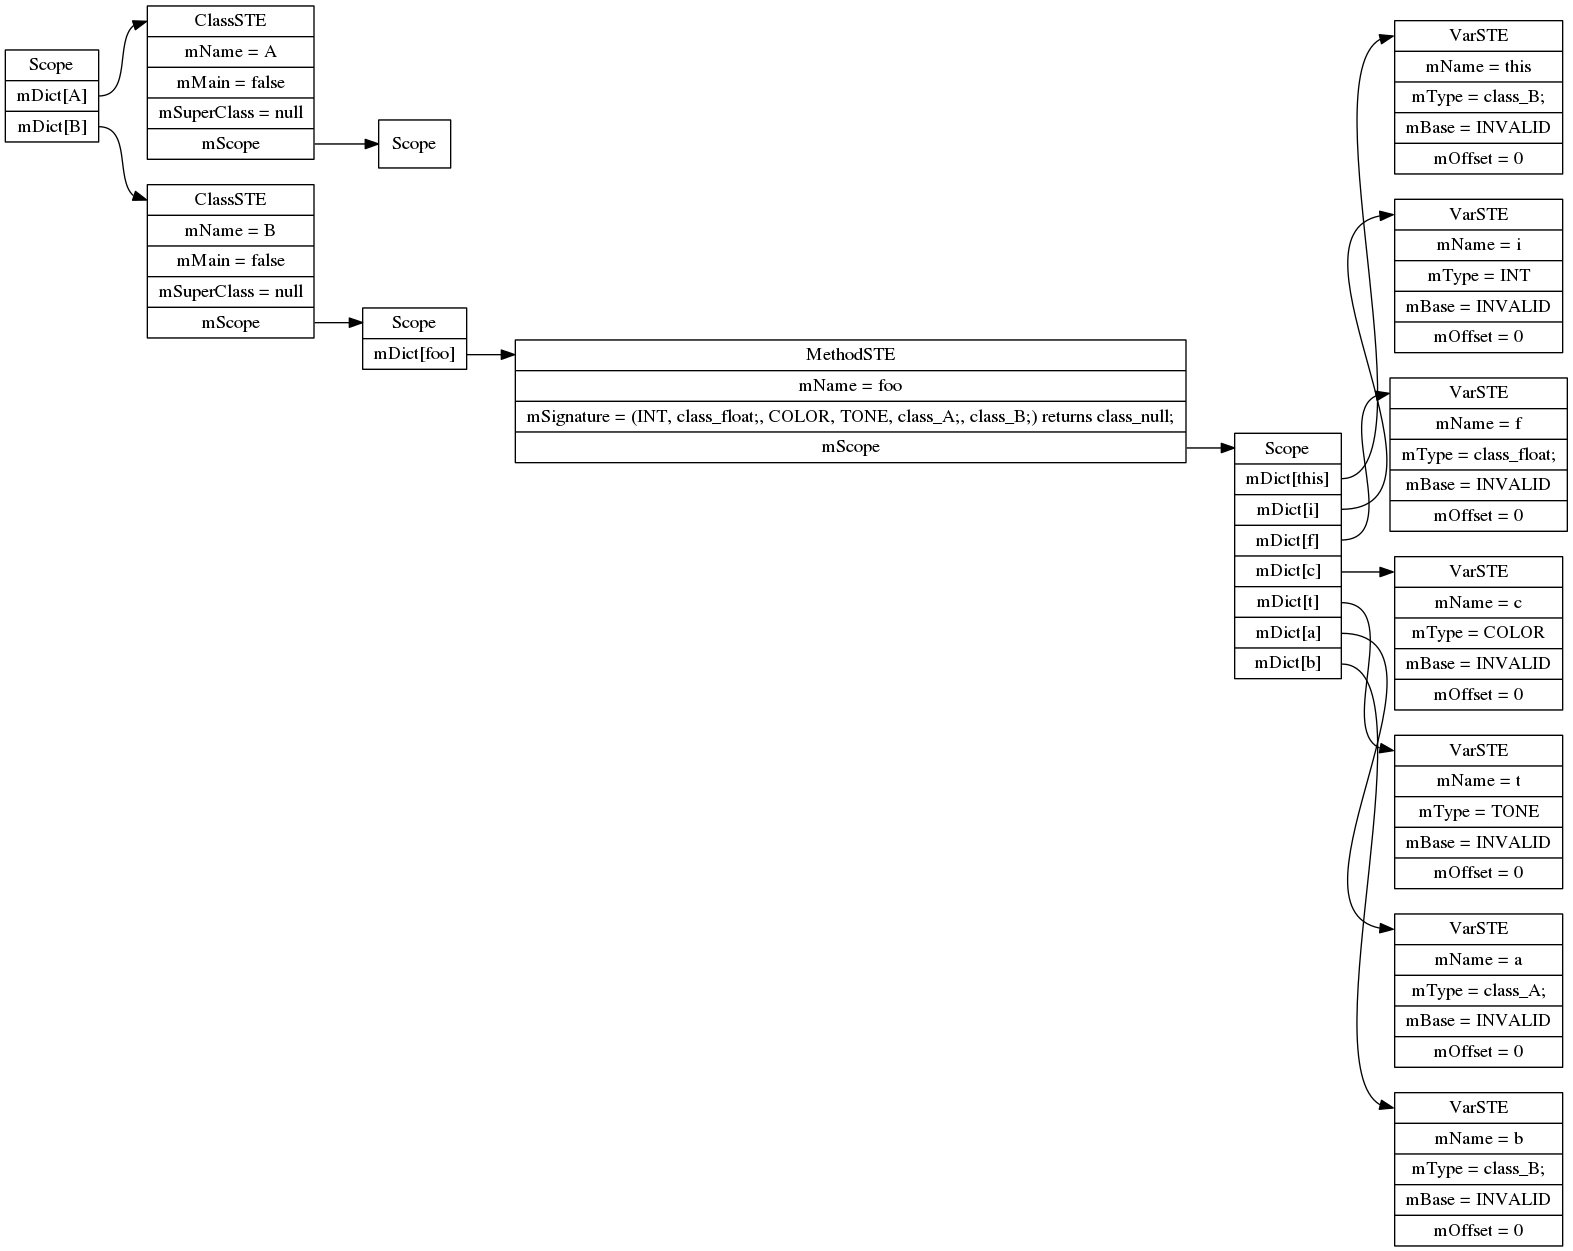
digraph SymTable {
	graph [rankdir="LR"];
	node [shape=record];
	0 [label=" <f0> Scope | <f1> mDict\[A\] | <f2> mDict\[B\] "];
	0:<f1> -> 1:<f0>;
	1 [label=" <f0> ClassSTE | <f1> mName = A| <f2> mMain = false| <f3> mSuperClass = null| <f4> mScope "];
	1:<f4> -> 2:<f0>;
	2 [label=" <f0> Scope "];
	0:<f2> -> 3:<f0>;
	3 [label=" <f0> ClassSTE | <f1> mName = B| <f2> mMain = false| <f3> mSuperClass = null| <f4> mScope "];
	3:<f4> -> 4:<f0>;
	4 [label=" <f0> Scope | <f1> mDict\[foo\] "];
	4:<f1> -> 5:<f0>;
	5 [label=" <f0> MethodSTE | <f1> mName = foo| <f2> mSignature = (INT, class_float;, COLOR, TONE, class_A;, class_B;) returns class_null;| <f3> mScope "];
	5:<f3> -> 6:<f0>;
	6 [label=" <f0> Scope | <f1> mDict\[this\] | <f2> mDict\[i\] | <f3> mDict\[f\] | <f4> mDict\[c\] | <f5> mDict\[t\] | <f6> mDict\[a\] | <f7> mDict\[b\] "];
	6:<f1> -> 7:<f0>;
	7 [label=" <f0> VarSTE | <f1> mName = this| <f2> mType = class_B;| <f3> mBase = INVALID| <f4> mOffset = 0"];
	6:<f2> -> 8:<f0>;
	8 [label=" <f0> VarSTE | <f1> mName = i| <f2> mType = INT| <f3> mBase = INVALID| <f4> mOffset = 0"];
	6:<f3> -> 9:<f0>;
	9 [label=" <f0> VarSTE | <f1> mName = f| <f2> mType = class_float;| <f3> mBase = INVALID| <f4> mOffset = 0"];
	6:<f4> -> 10:<f0>;
	10 [label=" <f0> VarSTE | <f1> mName = c| <f2> mType = COLOR| <f3> mBase = INVALID| <f4> mOffset = 0"];
	6:<f5> -> 11:<f0>;
	11 [label=" <f0> VarSTE | <f1> mName = t| <f2> mType = TONE| <f3> mBase = INVALID| <f4> mOffset = 0"];
	6:<f6> -> 12:<f0>;
	12 [label=" <f0> VarSTE | <f1> mName = a| <f2> mType = class_A;| <f3> mBase = INVALID| <f4> mOffset = 0"];
	6:<f7> -> 13:<f0>;
	13 [label=" <f0> VarSTE | <f1> mName = b| <f2> mType = class_B;| <f3> mBase = INVALID| <f4> mOffset = 0"];
}
dot -Tpng input.dot > output.png