Icon Analyst 43 -- Supplementary Material
Last updated November 19, 1997.
Kaleidoscopic Visualization
Figure 1. The Kaleidoscope Interface
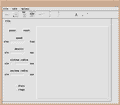
Figure 2. The Visualization Interface
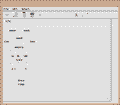
Figure 3. Allocation Color Coding
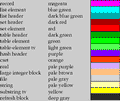
Figure 4. An Example Visualization

Figure 5. Allocation During Cataloging
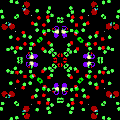
Figure 6. Outputting the Concordance

Figure 7. List Allocation from Sorting a Table

Figure 8. List Allocation from Sorting a Table

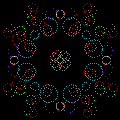
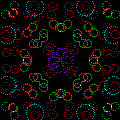
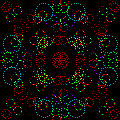
Other Visualizations Not Shown in the Analyst


Icon home page


