Visualizing Trees

Michael S. Shipman

Department of Computer Science
The University of Arizona
Tucson, Arizona

IPD275
March 24, 1996
http://www.cs.arizona.edu/icon/docs/ipd275.htm


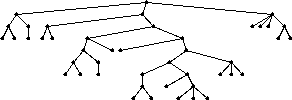
A tree is one specific kind of graph that is very important in applications ranging from Computer Science to many other fields [GROS90]. Trees are often used in the implementation of file systems, in evaluation of arithmetic expressions, and in replacement of linked lists where linear access time is forbidden. A conventional graphical representation of a tree is shown in Figure 1.


Figure 1: The Conventional Presentation

However, such conventional presentation techniques are inadequate in many cases such as when trees are broad and/or deep and for understanding the relationships between nodes. An alternative approach is to arrange the nodes in such a way that there is a relationship between the location and the size of each node as well as to be able to represent a tree of considerable size. This paper describes, using images of the same tree as in figure 1 for comparison, two different and new approaches used in this research: directed and layered. The images described are the results from the application drawtree that has been written in Icon programming language [GRIS90] [GRIS95] to explore these areas. The application is only concerned with the shape of the tree and the relationships between nodes, not identifying specific nodes.
Before describing the two different approaches, it is important to define a few terms used in this paper. A rooted tree T is a connected acyclic directed graph in which each node is connected by a unique path from a designated node called the root. Node v is a child of node u if uv is a directed edge of T and u is the parent of v. Two or more different nodes with the same parent are siblings. All the nodes on the unique path from the root r to node v other than v itself are the ancestors of v. If u is an ancestor of v, then v is a descendant of u. Now that the terms have been defined, the directed approach of the tree will be explained.

2. Directed Approach

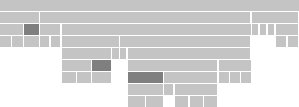
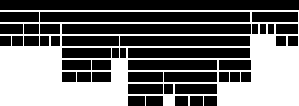
A representation of a directed-approach tree is shown in figure 2 and consists of horizontal bars where all bars at a given vertical level belong to one generation.


Figure 2: Directed Graph, horizontal-bar representation

2.1 Concepts and Advantages

All children of a particular node N are represented by bars directly beneath the bar representing N. The sum of the length of the bars representing the children of N is equal to the length of N except if N has no children. The length of the bar corresponding to N is determined as follows: One considers all of the descendants of the parent P of N. Then the ratio of the length of N to the length of P is equal to the ratio of the number of descendants of N (plus one to include N itself) to the total number of descendants of P.

The advantages of this approach are that it gives more room to a node that has more descendants than others. Therefore, one can visually select which node has more descendants than others by looking at the length of the bar. It is also simple to visualize the parent or ancestors of a certain node by observing the nodes directly above it. Likewise all the nodes directly below it are its descendants. Also, by comparing the length of a node with the lengths of its siblings, one can determine whether it has more or fewer descendants than its siblings. One can also easily distinguish all the nodes that lie in the same path from the root by drawing a straight line vertically. Overall, the two major advantages of this approach are that it is balanced in the sense that all nodes are placed below their ancestors and that the size of a node is determined by the number of descendants.

2.2 Two Different Layouts

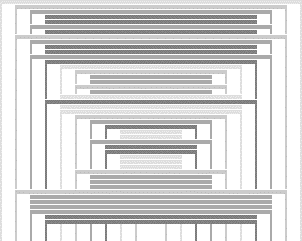
Figure 2 shows one of the two different ways to lay out the bars. The tree starts out with the root as a straight bar at the top. It is the longest bar since all its descendants are below it, and each descendant is represented with a smaller bar as the tree begins to branch. In fact, each node can be treated as a root of a subtree with all of its descendants directly below it.

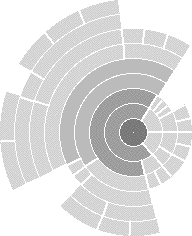
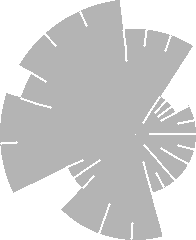
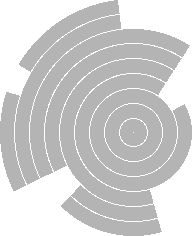
Figure 3 shows another layout of the graph. Instead of each node being represented with a straight bar, each bar is is represented by an arc so that connecting all the arcs of the same level create part of a circle. The root of the tree starts in the middle and the tree branches out from there in all directions rather than starting from the top and branching down. Since the tree spreads out in all directions, the size of the bars do not decrease as drastically as in the horizontal-bar representation.


Figure 3: Directed Graph, the arc-bar representation

2.3 Variations

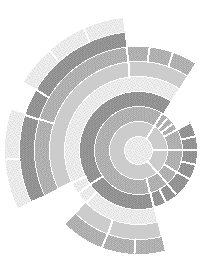
Several variations can be applied with these particular layouts. For example, different colors can be assigned to nodes to convey meaning or show relationships among nodes. In figures 4 and 5, each generation, or level, is represented with a color. However, to avoid using too many colors, the sequence of colors is repeated after a certain number of generations or levels. An estimation of the depth of the tree can be calculated by counting the number of sequences.


Figure 4: Each generation is represented with a color


Figure 5: Each generation is represented with a color

Another approach in the use of a color scale is when each node is colored based on the number of its descendants. In a tree with N nodes and M colors, the first scale represents any node that has between 0 and N/M descendants and the last scale represents any node that has between (M-1)N/M and N descendants. Thus each color covers a number-of-descendants range of about N/M nodes. Figure 6 is an example in which all four colors are used.


Figure 6: Each node is colored based on the number of its descendants

Figure 7 is an example in which a specific generation can be selected and each child on that level and its descendants are colored by a unique saturation of a certain hue. The level represented in figure 7 is three (the root being 0). Since there are two nodes on that level, there are two different saturations to represent each node and its descendants.


Figure 7: Specific generation selected

If color is too confusing or to get a general impression of a tree in which color has no meaning, each node can be represented with the same color as shown in figures 2 and 3. Figure 8 is another example with the background darker than the bars.


Figure 8: An example with a black background

Figure 9 shows a conventional view of a tree. The concept of where each node is located is the same as described earlier. The space between each adjacent node is determined by the number of all of its descendants as compared with its siblings. The two different views of the tree can be superimposed onto one diagram such as in figure 10.


Figure 9: Conventional view of a tree


Figure 10: Two different views of the tree superimposed onto one diagram

A tree can also be simplified by deleting information that may not be necessary. In figure 11, for example, the layer or the generation information is discarded. There is no space separating the levels. Figure 12 discards the number of children and descendants a node has as well as the number of siblings of each node. An extreme example is to use a single color and eliminate all the spaces that separate a node from another such as in figure 13. This provides only a very general impression of the tree.


Figure 11: The layer (generation) information is discarded


Figure 12: The number of children or descendants information is discarded


Figure 13: Very general impression of the tree

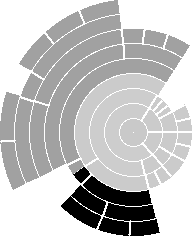
Finally, a user can request all the nodes that have a specific number of children be highlighted. In figure 14 for example, all of the nodes with a single child are highlighted in a darker gray.


Figure 14: All the nodes with a single child are highlighted.

2.4 Result

In the directed approach, the arrangement of the nodes in such a way that there is a relationship between the location and the size of each node is significantly better than in the conventional techniques. Plate A shows a different view in which the directed approach can be used when a tree is broad and/or deep. Here, it is simple to visualize the ancestors of a node and its descendants as well as the relationship of its sibling.

3. Layered Approach

3.1 Concepts and Advantages

Another conventional technique is the hypergraph [HARE88] (figure 15) in which an edge no longer connects a pair of nodes, but a node is considered a subset of its parent.


Figure 15: The hypergraph representation

This technique captures a purely topological notion of connectedness in which ancestor and sibling relations are easily visualized. It is a useful way of representing a collection of nodes together with some structural relationship between them. However, the difficulties lie in how much space should be given for each node. Also, as the depth of the tree increases, it gets difficult to read a stack of layers, and it may be impractically difficult to lay out a large tree. A similar concept is used in the layered approach.

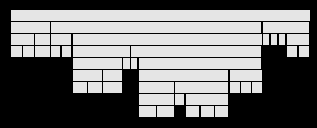
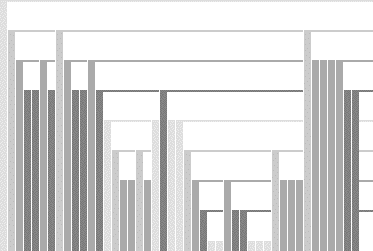
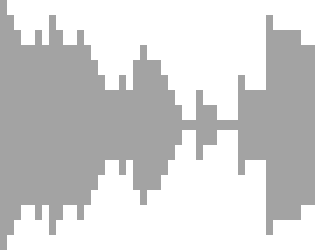
In the layered approach, as shown in figure 16, there is one bar per horizontal line. A bar representing a node at a certain generation has a length one unit shorter than its parent. Its descendants are placed below it, and only after all of its descendants are listed can a sibling appear, followed by its descendants. It is easy to locate generations by comparing the height of each bar. The older generations are indicated by taller bars while the younger generations are indicated by the smaller bars. It is also easy to see the descendents of a certain node by looking at all the nodes directly to the right that are smaller than that certain node. Likewise, the ansectors of that node are to the left. Comparing the siblings is also easy since each bar is of the same height and is classified with the same color and parent. The amount of space given to the right of each node is determined by the number of its children. Distant relatives can also be analyzed by comparing the nodes of the same or different generations. The two major ways the bars can be laid out are horizontally, in which the root is the top (figure 16), and vertically, in which the root is at the side (figure 17). Therefore, the tree can be viewed either from the top down or from left to right. The bars can be justified in various ways: centered, right justified, or left justified.


Figure 16: Layered Approach, horizontal layout


Figure 17: Layered approach, vertical layout

3.2 Variations

The basic concept of the use of color for the directed approach also can be applied here. Figures 16 and 17 are examples in which each generation is represented with a certain color. Figure 18 is an example in which each node is represented with a color based on its number of descendants. Each node can also be represented with a single color as shown in figure 19.


Figure 18: Color based on the number of descendants


Figure 19: Each node is represented with a single color

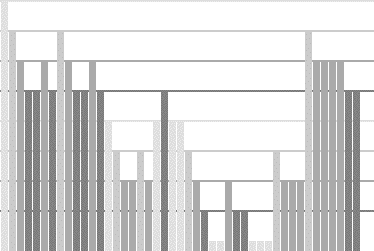
At the beginning and the end of each bar, lines can be drawn starting from that bar to the last bar representing its descendants. These lines act as an enclosure or as a protector around their descendants. In this way, the descendants of a particular node can be grouped more easily. As shown in figure 20, the lines can also be drawn all the way across while the bars lie over them. In this way, one can visually see the grid lines beneath the bars and use them to compare nodes of the same generation of the same or different parents. The other option is not to have grid lines at all (figure 21).


Figure 20: Grid lines drawn under the bars


Figure 21: No grid lines and population bar graph.

As in the directed approach, a conventional tree representation can also be viewed as independent or superimposed upon the layout of the tree mentioned above (figure 22). A dot representing each node is placed at the end of each bar and the edges are connected to its children. Each layer only represents a single node and the beginning of the root depends on the layout and justification. If the layout is vertical and the justification is on the left, then the the root starts from the upper lefthand corner. The location of each dot depends on the generation in which it appears and the layer on which it is located.


Figure 22: Conventional tree superimposed on the layout approach

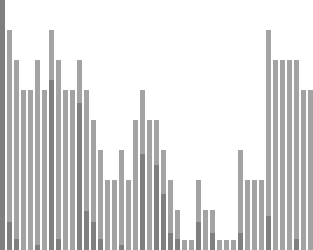
Population bar graphs can also be viewed as shown in figures 21 and 23. For each node, the length of the superimposed population bar is determined by the number of descendants it has as compared to the total population. Therefore, the length of the population bar of the root should be of the full length, since it is the ancestor of all the nodes. The population bar graph can be viewed alone or with the traditional view of the tree.


Figure 23: Popluation bar graph and simplifed tree

Finally, a tree can be simplified by deleting information. Possibilities are to delete the space separating each bar, omit grid lines, etc. (figures 23 and 24).


Figure 24: Middle justification and simplified tree

3.3 Result

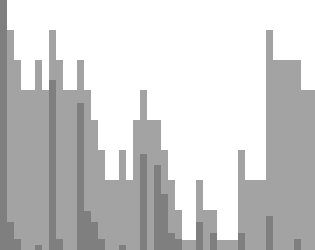
The concept that was just described is significantly visually better than the conventional technique of hypergraphs (compare figure 15 with each of the figures described). This is acccomplished by stacking the layers on the side of each other rather than stacking the layers upward. This way, it is easy to see each node and where it belongs as compared with other nodes. Plate B shows a different tree in which the layered approach can be used when a tree is broad and/or deep.

4. Data

A data file can be entered into the drawtree application. Each element that represents a node of the tree is represented by a string followed by a left bracket, [, a list of its children, and then a right bracket, ]. Therefore, the root of the tree is first. For example, consider the following tree:
animals[mammas[land[]water[]]reptile[]]
The two children of the root animals are mammals and reptile. ended with []. Figure 25 represents this tree.

drawtree can also randomly generate a tree by giving the maximal number of nodes and the maximal number of children each node can represent. This is mainly used to test the application and try different possiblities. This application also can create a tree for the current file directory.


Figure 25: Tree representing animals[mammals[land[]water[]]reptile[]]

5. Conclusion

Rather than using conventional presentation techniques, different approaches can be used to arrange the nodes in such a way that there is a relationship between the location and the size of each node. Two different and new approaches have been described. The directed approach gives more room to a node that has more descendants than others while the layered approach is very much like hypergraph but the layers are stacked on the side of each other rather than stacking upward. These two new approaches give different and new ways to visualize a tree that may be more meaningful.

This project was only concerned about the relationship between nodes and the shape of the tree. There are several possibilities for the future directions of the project. Clicking on a node to bring up its label is one possibility. Color could be further exploited and developed. A tree could also start from the leaves with each having the same size and be built upward to the root.

6. References

[GRIS90] Griswold, R. E. and Griswold, M.T. The Icon Programming Language, second edition. Prentice-Hall, Englewood Cliffs, New Jersey, 1990.

[GRIS95] Griswold, R.E., Jeffery, C.L., and Townsend, G.M. Graphics Programming in Icon, draft, 1995.

[GROS90] Grossman, Jerrold W. Discrete Mathematics. Macmillan Publishing Company, New York, 1990.

[HARE95] Harel, D. On Visual Formalism. Communications of the ACM, volume 31, number 5, page 171-187, May 1988.

[KELL93] Keller, P.R. and Keller M.M. Visual Cues: Practical Data Visualization. Manning Publications Co., Greenwish CT, 1993.

[MACL83] McCleary, Jr. G.F. An Effective Graphics "Vocabulary." IEEE Computer Graphics and Applications, volume 3, number 2, page 46-53, March/April 1983.

[WEIS93] Weiss, Mark Allen. Data Structures and Algorithm Analysis in C. The Benjamin/Cummings Publishing Company, Inc, Redwood City, California, 1993.
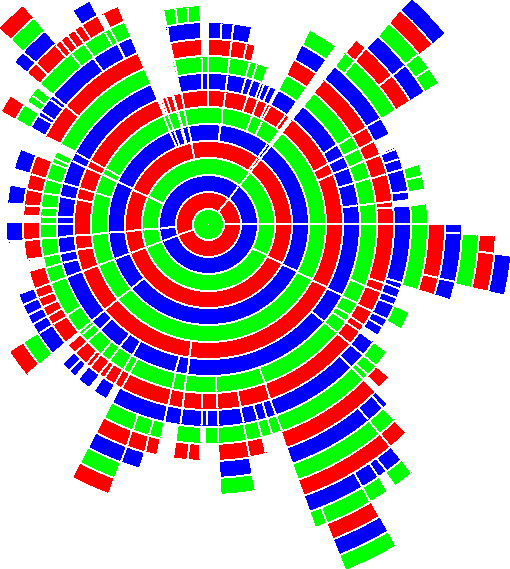
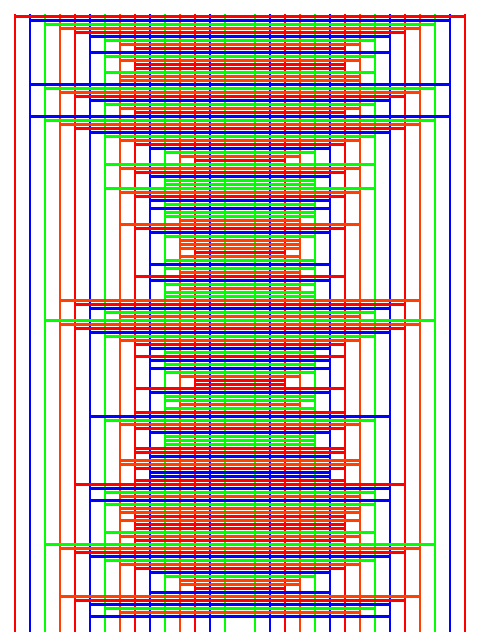


Plate A: Arc-bar representation of a large tree


Plate B: Horizontal layout for a large tree


Icon home page