![[newsletter masthead]](../inl_mast.gif)
![[dragon masthead]](../dragonc.gif)
No. 53 -- August 1, 1997
No. 53 -- August 1, 1997
Todd Proebsting, Gregg Townsend, and Denise Todd have begun development of an entirely new implementation of Icon. The new system targets the Java Virtual Machine and so provides platform independence for translated Icon programs. This system includes an Icon translator written in Icon and a run-time system written in Java.
The Java Virtual Machine (JVM) is a platform-independent execution environment for programs distributed as Java class files. Class files include executable code (a compact stack-machine byte code) and linking information, much like ordinary object files. JVM implementations execute class file code either through interpretation or by compilation to directly executable machine code. JVM implementations also provide services like garbage collection and thread support in addition to a large set of library procedures.
Although the JVM was designed for Java, it can also support other languages. The new Icon translator reads Icon source files and writes Java class files. Combining these with the run-time system produces a Zip file that is composed entirely of class files and can be run on any platform supporting Java. (JVM implementations are freely available for every major computer system.)
This system is as complete an implementation as is possible given the limitations of the Java Virtual Machine. The system does not support kbhit(), for instance, because there is no such functionality in the JVM. Otherwise, the system implements the full Icon language. It does not, however, support graphics or large integers.
Development began in the Fall of 1996, with Denise Todd's implementation of the lexical analyzer and parser for Icon. (Denise recently graduated from The University of Arizona with an MS in Computer Science.) This past Spring Todd Proebsting implemented the rest of the translator. Todd Proebsting and Gregg Townsend concurrently developed the run-time system. The translator uses a new mechanism for evaluating generators and performing goal-directed evaluation [1]. The run-time system is also a new design: It is completely object-oriented, with each of Icon's primitive types implemented as its own class, which greatly simplified the design.
A proof-of-concept implementation is now fully functional, validating the basic idea and the overall framework. Much work remains to bring the performance to a practical level; the initial implementation emphasized expediency over efficiency. Public availability will be announced at a later date.
Reference
1. Todd Proebsting, "Simple Translation of Goal-Directed Evaluation", Proceedings of the ACM SIGPLAN 1997 Conference on Programming Language Design and Implementation (PLDI).
Hiroshi Shinohara has graciously supplied documentation for Icon in Japanese. You can get it from our FTP site:
ftp:cs.arizona.edu
From there cd /icon/contrib/Japanese and get README.
In the last issue of the Newsletter, we mentioned a planned multi-volume work on programming languages. We now know a little more about it. It is to be published by Macmillan Technical Publishing. Five volumes are projected:
1. Object-Oriented Languages
2. Tools and Little Languages
3. Imperative Languages
4. Functional and Logic Languages
5. Page Description Languages
Volume 1 is scheduled to appear by the end of this year, Volumes 2 and 3 in 1998, and Volumes 4 and 5 in 1999.
The section on Icon, which will run about 100 pages, already has been submitted to the publisher.
The Icon Analyst is now starting its eighth year of publication.
We would like to increase the number of subscribers, but we know that the cost of subscription discourages some potential new subscribers.
So, for a limited time, we're offering a discount for new subscriptions -- $18 for one year, 28% off the normal subscription price of $25. (Overseas postage is $10 extra; we can't discount that.)
For this, you get six issues crammed full of interesting material about Icon and its applications. The Analyst is published in 8.5"x11" format, with at least 12 pages per issue. The current issue is 16 pages.
If you need more convincing, check out the Icon Web site, where there are contents listings and permuted indexes of past issues.
There also is a sample copy that shows what a typical Analyst looks like and a list of topics planned for future issues. Recently we've added on-line services for subscribers, including color images from the Analyst. You're welcome to check these out, although since this material is designed to supplement printed copies of the Analyst, there is no context for the images. To get to the images, start with the Icon home page:
http://www.cs.arizona.edu/icon/
In the Documentation section of our home page, follow the link to The Icon Analyst. On that page, follow the link Supplementary material for subscribers. On that page you'll find links to issues of the Analyst (right now, there is only Icon Analyst 43).
The discount subscription offer only applies to persons who have not previously subscribed to the Analyst or who have not subscribed for at least one year. This offer is good only until October 1, 1997. Act now.
Subscriptions at the promotional rate start with Issue 43, August 1997.
Incidentally, if we get enough new subscriptions, we may be able to lower the standard subscription rate to everyone's benefit.
$18 is not much when spread over a year -- only $3 an issue. Take advantage of this offer; you're not risking much and you may get a substantial return on your "investment".
To get the special pricing, be sure to mention this promotional offer.
Last spring semester, we taught a graduate-level course on program visualization.
The term "software visualization" now is used more frequently than "program visualization", but "software visualization" and "scientific visualization" have the same initials and we decided there would be less confusion if we used "program visualization". Besides, it made file naming easier.
The class first surveyed the major areas of visualization and the techniques used in them:
Scientific visualization, which is concerned with the physical universe, real or imagined, ranging from molecules to interstellar gas.
Mathematical visualization, which is concerned with mathematical objects and concepts. Mathematical visualization usually is classified with scientific visualization, but the subjects and techniques used are sufficiently dissimilar that we decided to separate them.
Information visualization, which is concerned with databases and other large collections of data.
Algorithm animation, which is concerned with algorithms.
Program visualization, which is concerned with what goes on during the execution of a program.
Algorithm animation and program vis-ualization may seem similar, but algorithm animation concentrates on specific algorithms like sorting, while program visualization is concerned with all aspects of program behavior. Many of the techniques used in algorithm animation, however, are applicable to program visualization.
Following this survey, the techniques and problems related to program visualization were presented.
The body of the course consisted of studying the visualization of various aspects of program behavior and designing new techniques and visualizations.
As you might expect, the course used Icon both as a subject of investigation and as a tool. Icon is particularly suitable for program visualization, since it has high-level facilities that cannot easily be related to the underlying architectures of the computers on which it runs. Features such as automatic storage management, generators and goal-directed evaluation, and string scanning are particularly good candidates for visualization.
The large collection of visualization tools related to Icon that already existed provided considerable leverage and allowed much more territory to be covered than would have been possible otherwise.
MT Icon [1] was used to obtain information about running programs, and Icon's graphics facilities allowed students to produce visual displays with a minimum of effort.
Students designed and implemented individual visualization projects in lieu of a final exam.
Thirteen students enrolled. All completed the course and all projects were good to excellent -- a considerable improvement over the first offering of this course 3 years ago. The availability of better tools is the probable reason for the improvement. As is typical of student projects, however, only a few were fully functional and robust.
Brief descriptions of the student projects, together with representative images, follow.
1. The MT Icon Interpreter, Clinton L. Jeffery, Icon Project Document IPD169, Department of Computer Science, The University of Arizona, 1992.
Scott Baker: This program visualizes structures that are the values of variables. Structures are color coded and shown by bars whose lengths are proportional to size. Clicking on a bar brings up another window with a subset of the functionality of the main window. There, the values in the structure are shown. Clicking on a value brings up another window, and so on.

Brett Gulledge: "Vines" displays the creation and usage of various kinds of data, represented as objects on evolving vines. When a procedure is called, the vine branches. Objects start out as flowers and develop into fruit as they are used by the program. As new vines grow, old ones are covered and wither. Clicking on an object brings up a dialog with information about it.

Dan Nicolaescu: "bula" visualizes procedure activity. Procedures are laid out on a circle. The sizes of circles around the procedure nodes indicate how much memory they allocate, and the colors represent the number of times the procedure has been called. Lines connect procedures that are called and increase in thickness with the number of calls. Return, failure, and suspension are shown by transient lines of different colors.

Chin Guok: "reach" visualizes variable dereferencing and assignment using a "piano-roll" display. The user can select a variable by clicking on the roll and then assign colors for showing subsequent assignment and de-referencing.

Michael Hast: This program recreates the earlier MemMon tool that was lost when the implementation of Icon changed from memory-monitoring instrumentation to MT Icon instrumentation. Allocation in the string and block regions is shown, color coded by type and in proportion to the amount of allocation. Clicking on a rectangle brings up a dialog showing the type of allocation and the amount of space allocated.

Larry Huebel: "Co-Axe" visualizes co-expression activity. Individual co-expressions are color coded for identification. Every co-expression action adds a box for that co-expression. Clicking on a box brings up a dialog with information about the nature of the activity, where in the program it occurred, and so on.

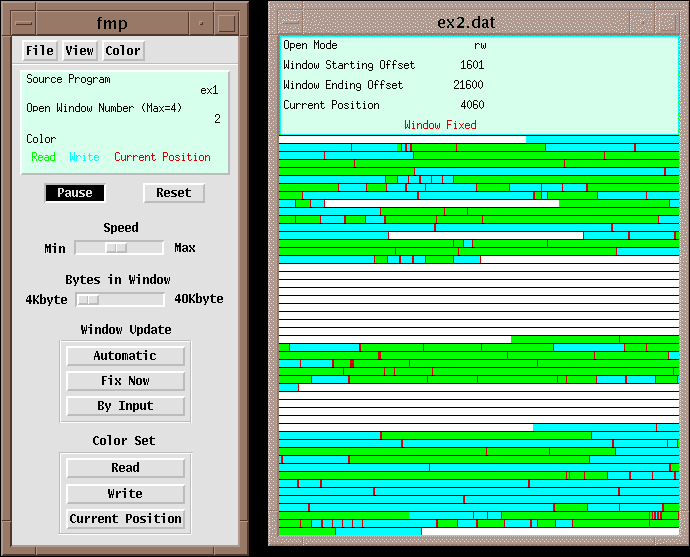
Ilwoo Chang: "fmp" (file monitor program) visualizes file activity: opening, closing, reading, writing, and seeking. The control window allows the user to control monitoring. In addition, there may be one or more file windows showing individual files. As data is read and written, it is shown in the file window with the current position highlighted.
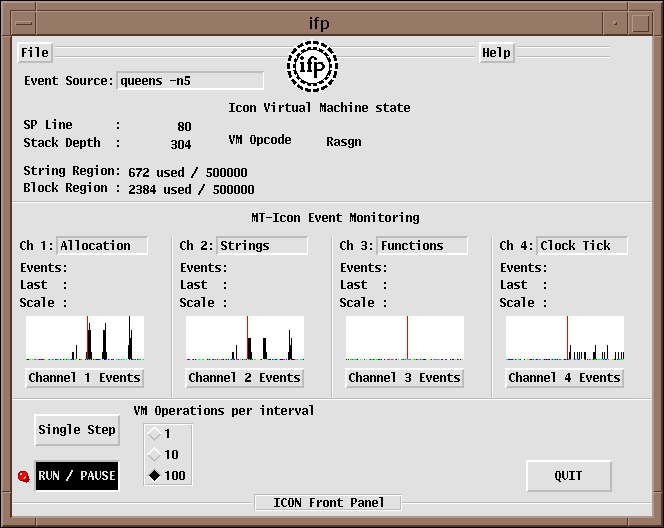
Jeffrey Miller: ifp (Icon front panel) visualizes Icon's virtual machine. Various information is shown in the top part of the display. There are four monitoring channels below, allowing four different kinds of activity to be monitored simultaneously. Many kinds of events can be monitored, including various types of expression evaluation, allocation, and even virtual machine instructions.
Xaionan Han: "evMon" visualizes a variety of program execution events. Events are represented hierarchically. At the top level, there are general categories like expression evaluation. At lower levels the events become more specialized, such as function, operator, procedure, and assignment activity. Events are color coded and scroll in the region at the center of the window. The "ruler" at the bottom shows the locus of program execution measured in percentage of program length.

Todd Rudick: "finealloc" visualizes the details of structures as the are created and used. Clicking on a line in the code region in which a structure is created marks that structure for subsequent tracing. The histogram region shows a list of structures being traced.

Shih-Han Liu: "Tracer" shows evaluation activity the source code. Colors code the number of evaluations on a line. The source code can be set to scroll or move to the currently executing line. Font size can be changed to accommodate programs of different sizes.

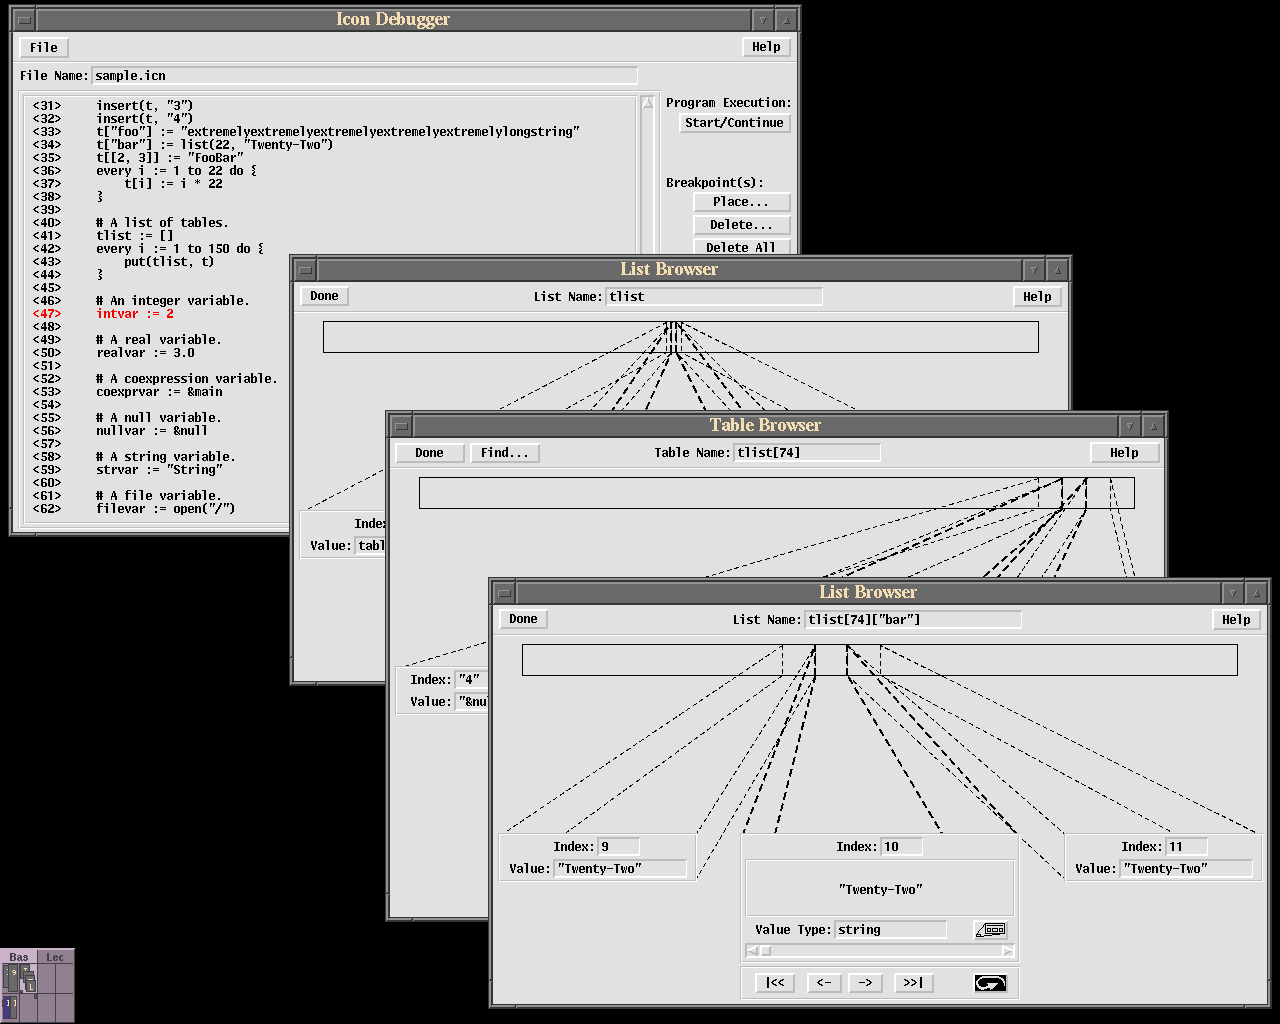
Brad Traweek: "IDB" (Icon debugger) is a full-fledged Icon debugger. The user can set break points in the program and then examine the contents of structures when a break point is encountered. There are value browsers that can be used, for example, to inspect the contents of structures interactively. Clicking on a value in a structure brings up a browser for that value.
Venkata Yella: This program visualizes storage allocation and procedure activity. The types of allocation are color coded. The total amount of allocation by type is shown in a scrolling region. The types of allocation to view can be selected by the user. Procedure activity is shown at the bottom.

Comments: Brad Traweek's debugger is unquestionably the best of the lot in terms of technical excellence. Unfortunately, because of the limitations of MT Icon, it requires two passes: one to set the break points and another to use them. We hope to overcome these problems at a future date.
Brett Gulledge's "Vines" is the most original and interesting
visualization we've seen. It was overly ambitious, as he knew, and was not
completely functional at the time projects were due. It nonetheless ranks
with the few outstanding student projects that our program visualization
classes have produced.