Caterpillar -- A Tool for Visualizing Procedure Calls and Expression Flow in Icon

Nick Kline

Department of Computer Science
The University of Arizona
Tucson, Arizona

IPD170a
March 24, 1996
http://www.cs.arizona.edu/icon/docs/ipd170.htm


Editor's note: The tool described in this paper did not survive subsequent software changes. It is described here to show the concepts involved.

The references are those current at the time of this revision, not the ones referenced when the report was written.

Introduction

Caterpillar is a tool designed for viewing both procedure calls and expression flow in Icon programs. Both types of events may be viewed in separate or combined ways.

Using Icon's event capture facilities [1], Caterpillar processes a program's events and captures the events for procedure activation [2] and expression evaluation.

Events such as procedure returns, calls, and failure are tracked. Expression-level events are also tracked: alternation, expression failure, and so forth. In addition, the current row and column location in the source code are tracked.

These events can be used to determine which procedure is currently active, or where the thread of execution is in terms of position in the Icon source code. This information can be used to display the current location in the executing procedure.

Caterpillar uses the Icon Windows interface [3] to display the information.

Using Caterpillar

To use Caterpillar, the original Icon source file as well as an associated event file are needed. The source file is processed with a variant Icon translator [4] that is used to determine static information, such as which procedures explicitly call other procedures and the starting and ending locations of procedures in the source code. This information is used to draw a graph with lines connecting explicit procedure calls. Analysis of the source code to determine implicit procedure calls is beyond the scope of this program.

Caterpillar uses a caterpillar, or a trail of marks, to show the recent history of procedure activation. When a procedure A calls procedure B, a trail of marks proceeds from the calling procedure A to the called procedure B. The marks leading to the called procedure are black, and the marks leading back are red (the same color scheme is used for other procedure activation behavior, such as resuming an already called procedure).

Expression flow can also be tracked. In this case, when a procedure is active, a window is displayed with the source code of the procedure. A mark indicates the execution location within that procedure (the row/column location of that execution). The mark follows the execution context within that procedure.

Appendix A contains a user's manual for Caterpillar. Snapshots of displays produced by Caterpillar are contained in Appendix B.

Conclusion

Caterpillar is useful for viewing Icon events on both a high and a low level. The visualization techniques seem to scale with large programs.

Programs with many procedures and long chains of procedure calls work best, while mutual recursion is not visualized well at all.

Caterpillar could be extended in many ways. Other types of events, for instance garbage collections, could be shown as different types of marks on the source code and the procedure call graph.

References

1. R. E. Griswold, Writing Icon Program Execution Monitors, The Univ. of Arizona Icon Project Document IPD264, 1996.

2. N. Kline, Shrub -- A Tool for Visualizing Procedure Activity in Icon, The Univ. of Arizona Icon Project Document IPD153, 1990.

3. G. M. Townsed, R. E. Griswold, and C. L. Jeffery, Graphics Facilities for the Icon Programming Language; Version 9.1, The Univ. of Arizona Icon Project Document IPD268, 1996.

4. R. E. Griswold and K. Walker, Variant Translators for Version 9 of Icon, The Univ. of Arizona Icon Project Document IPD245, 1995.


Appendix A -- User's Manual for Caterpillar

Usage

Caterpillar source-file event-stream

Description

Caterpillar visualizes the information from Icon event monitoring files. There are two levels of abstraction: procedure-level and expression-level. The default is procedure-level.

A graph of the explicit procedure calls is drawn, topologically sorted from the main procedure. As the event stream is processed and events occur between the various procedures, a "caterpillar" follows these events. This trail is a line of marks that are black when flowing toward a called procedure, and red when returning to the calling procedure.

Implicit procedure calls do not result in a connection between nodes in the graph. If there are such calls, however, the caterpillar follows the trail.

The user is presented with a control panel and the main window. The control panel has a quit button to end execution of the program, a button to allow reordering of the main window, and a slider to slow or increase the speed of the caterpillar.

Clicking on the reorder button allows the user to rearrange the layout of the procedure nodes. A node of the graph can be selected and dragged to another location to change the layout. Clicking on the done button terminates rearrangement.

Clicking on a procedure node selects that procedure for expression-flow visualization. Whenever there are events within the body of a selected procedure, a mark moves around the text of the procedure, indicating the location of expression evaluation in that procedure.

The procedure node is highlighted when expression-level events are being shown. A procedure can be deselected by clicking on it again.

The main window may be resized. The graph is redrawn in the proper proportions.

Appendix B -- Examples of the Use of Caterpillar

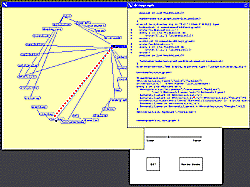
The figures that follow illustrate a sequence of operations that show the kind of operations that can be performed using Caterpillar.


Figure 1: The caterpillar trail (and execution) is returning from the procedure textdump for the procedure drawgraph. The control panel also is visible, with the buttons for quitting, reordering the display, and changing the speed of the caterpillar.
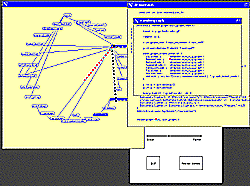


Figure 2: Several procedures have been selected for closer study. Note the mark in the window for drawgraph leading to the call of rendergraph.
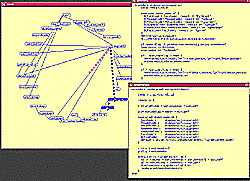


Figure 3: Control proceeds further, with drawgraph the currently executing procedure. Monitoring has been turned off in the drawgraph procedure.


Icon home page