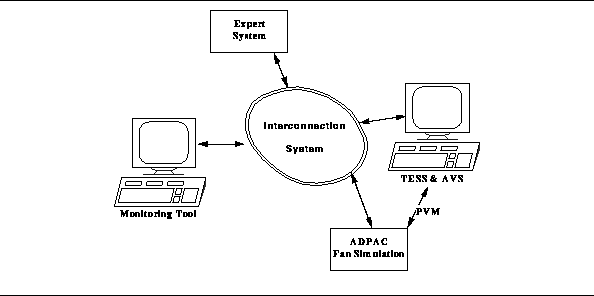
For clarity, only one ADPAC instance is shown in the figure. As experience with the system is gained, the expert system will be extended to provide active control, through the interconnection system, of ADPAC and TESS.
Development of an Intelligent Monitoring and Control System for a Heterogeneous Numerical Propulsion System Simulation
The immediate goal of this research is to build a monitoring and control system that can detect some of these types of problems and warn the user when they arise. The longer-range goal is the development of more complex rules and the corresponding controls to allow the expert system to actively steer the simulation. To realize the immediate goal, the monitoring tool displays information about the progress of each of the ADPAC simulations. The expert system receives data from the monitoring tool and passes back appropriate warnings to be displayed for the user. The interconnection system provides a transparent means of connecting the different parts into a single application. This system is illustrated below.
For clarity, only one ADPAC instance is shown in the figure. As experience with the system is gained, the expert system will be extended to provide active control, through the interconnection system, of ADPAC and TESS.
3.2.1 TAE+. TAE+ is a package that supports the rapid prototyping and construction of X-windows graphical user interfaces. It provides a workbench that facilitates the design and layout of the application's windows, allowing easy placement of the various objects within each window. A programming tools package allows the user to add code to the interface to provide program control over the various objects that make up the interface. Finally, a code generator automatically produces code, in a number of languages, that creates the interface and builds the main event loop for the application.
There are three basic building blocks available for use in designing windows for a TAE+ application. The first is a set of user-entry objects that allow the user to interact with the application through buttons, pull-down menus, and text fields. Second, there are data-driven objects that graphically display information from the application in real time through dials, strip-charts, thermometers, etc. The third category is information objects, such as text displays and help screens that provide the user with information or instructions about the application. The data-driven objects are particularly useful in a monitoring tool as they easily support receiving and reporting of continuous data during execution. A set of pre-defined objects are available that can be used to create vertical and horizontal scales, rotating dials, strip charts, etc. The user can also build objects specific to the application by creating a custom-object using the supplied drawing tools in TAE+ and defining the type of rotational, sliding, stretching, etc. data that will be supplied to the object. The data-driven object was a major reason for selecting TAE+ for this project, as it easily supports the type of monitoring needed for ADPAC.
3.2.2 CLIPS. An expert system built with CLIPS begins with a user-defined set of rules. The rules are written in a functional language and describe actions to take when specified conditions occur in the application. Typically, CLIPS supplies a window that displays information to the user about the application and shows the progress of the knowledge engine as the package works through the rules. A C language interface is also available that by-passes the CLIPS window and allows an application to be tied directly to the knowledge engine. This latter feature is being used in this current project. The C interface consists of function calls that pass data to CLIPS and return results from the rules. Callbacks through the C interface allow CLIPS to pass control commands to other components in the system.
3.2.3 Schooner Interconnection System. An interconnection system provides a model of computing that connects applications and implements a configuration management system, thus creating a meta-computation [10]. Each application contains one or several computations that accomplish a specific set of tasks, for example, the TESS or monitoring tool applications in the previous figure. In developing each application, the scientific programmer can use the combination of programming language, model, and architecture that is most suitable. The interconnection system starts each application on the appropriate host when needed and binds it into the meta-computation, and provides control flow and heterogeneous data exchange. Thus, the meta-computation is a heterogeneous, distributed program. At runtime, each application exports operations that can be invoked from other applications. For example, the monitoring tool exports operations that can be invoked by instances of ADPAC to report their progress. The interconnection system transparently handles the transfer of data and control among the applications making up the meta-computation.
A meta-computation requires configuration tools to assist the user in starting and controlling the component applications. The configuration management features of the system give the user both static and dynamic configuration control. Static control allows the user to select the applications that will be needed, such as the expert system and monitoring tools, and to begin execution. Dynamic control then allows applications to be added or removed as needed by the user or through commands issued by the applications themselves. For example, dynamic control is used by the monitoring tool to establish and break connections with instances of ADPAC.
The Schooner interconnection system realizes this model of scientific computing by supplying a software configuration and control mechanism for executing heterogeneous distributed computations. There are four, mostly orthogonal, parts to Schooner: a specification language, an intermediate data representation and accompanying data exchange library, a set of stub compilers, and a runtime support system. The Universal Type System (UTS) provides both the specification language and the intermediate data representation [7]. The specification language is machine- and language-independent and is used to describe the interface for each component application. The UTS intermediate data representation provides a medium for exchanging data across machine architectures and handling data structure differences among languages. The stub compilers, one for each supported language, read the UTS specifications and create the interface. The runtime system implements application-level remote procedure call (RPC) control transfer between components, as well as configuration and control features. It provides the user with a means of configuring the various applications in the computation, and provides the underlying communication and management support.
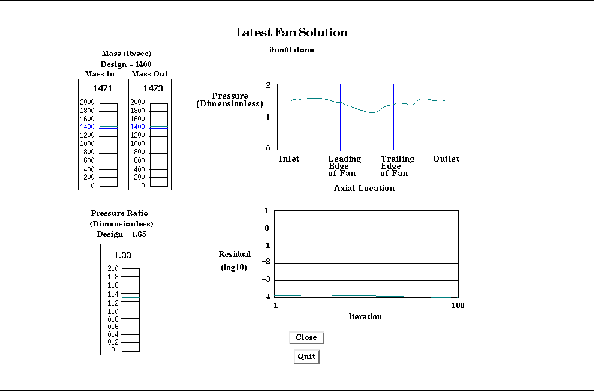
A prototype expert system receives data from the monitoring tool and provides several warning messages to the user in the form of pop-up windows. One example is shown below.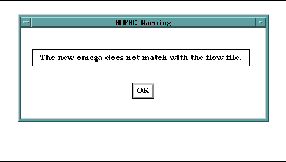
The monitoring tool uses the C language interface to CLIPS to pass data to the expert system. The pop-up windows, when appropriate, are then triggered by procedure callbacks from CLIPS to the monitoring tool.
Since the source code for ADPAC was not available for this project, the output data files are monitored instead. One of the data files is updated by ADPAC on each iteration during a run to report a number of quantities, including the desired residual, and several types of warnings. One limitation of this approach is an inability to affect ADPAC once execution has started. Thus, the expert system is currently limited to displaying warnings and errors in the monitoring tool, rather than being able to actively steer ADPAC.
To simulate the type of monitoring desired given the constraints, a watch-dog process is created on each machine executing ADPAC. This process uses an infinite loop to continuously check ADPAC's output file for new data. Whenever the file changes, the watch-dog examines the file for values of interest, specifically the residual values from each iteration and warnings of interest to the expert system. It also reads the average results from the mbave program at the completion of the ADPAC run.
Schooner connects the watch-dog processes to the monitoring tool through the use of UTS specification files. The specification file for the watch-dog process is shown below.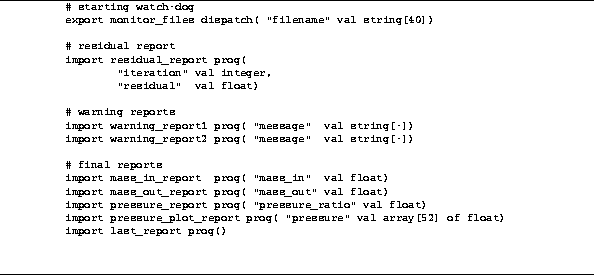
An import specification indicates a service in another application, in this case the monitoring tool, that the watch-dog process will invoke. An export is a service the watch-dog process provides to the monitoring tool. A analogous specification file is used with the monitoring tool. Each procedure specification lists the arguments using a Pascal-like syntax.
Execution of the watch-dog process is started after the monitoring tool receives from TESS the list of machines on which ADPAC is executing, and the corresponding list of output file names. Schooner's dynamic configuration library allows watch-dog processes to be started whenever needed by the simulation. Once the watch-dog has been started, the monitor_files dispatch is called. This tells the watch-dog the name of the output file to monitor, and starts the infinite monitoring loop. During execution, the watch-dog makes simple procedure calls, for example
residual_report(iteration, max_err);
is called to report the residual from the current iteration. The Schooner system transparently handles communications and data conversions among the machines.
Generated with CERN WebMaker